
This article has been machine-translated from Chinese. The translation may contain inaccuracies or awkward phrasing. If in doubt, please refer to the original Chinese version.
Characteristics of Front-end Debugging
Multi-platform
Browsers, Hybrid apps, Node.js, Mini Programs, Desktop applications…
Multi-environment
Local development environment, production environment
Multi-tool
Chrome DevTools, Charles, Spy-Debugger, Whistle, vConsole…
Multi-technique
Console, BreakPoints, SourceMap, Proxies…
Chrome DevTools
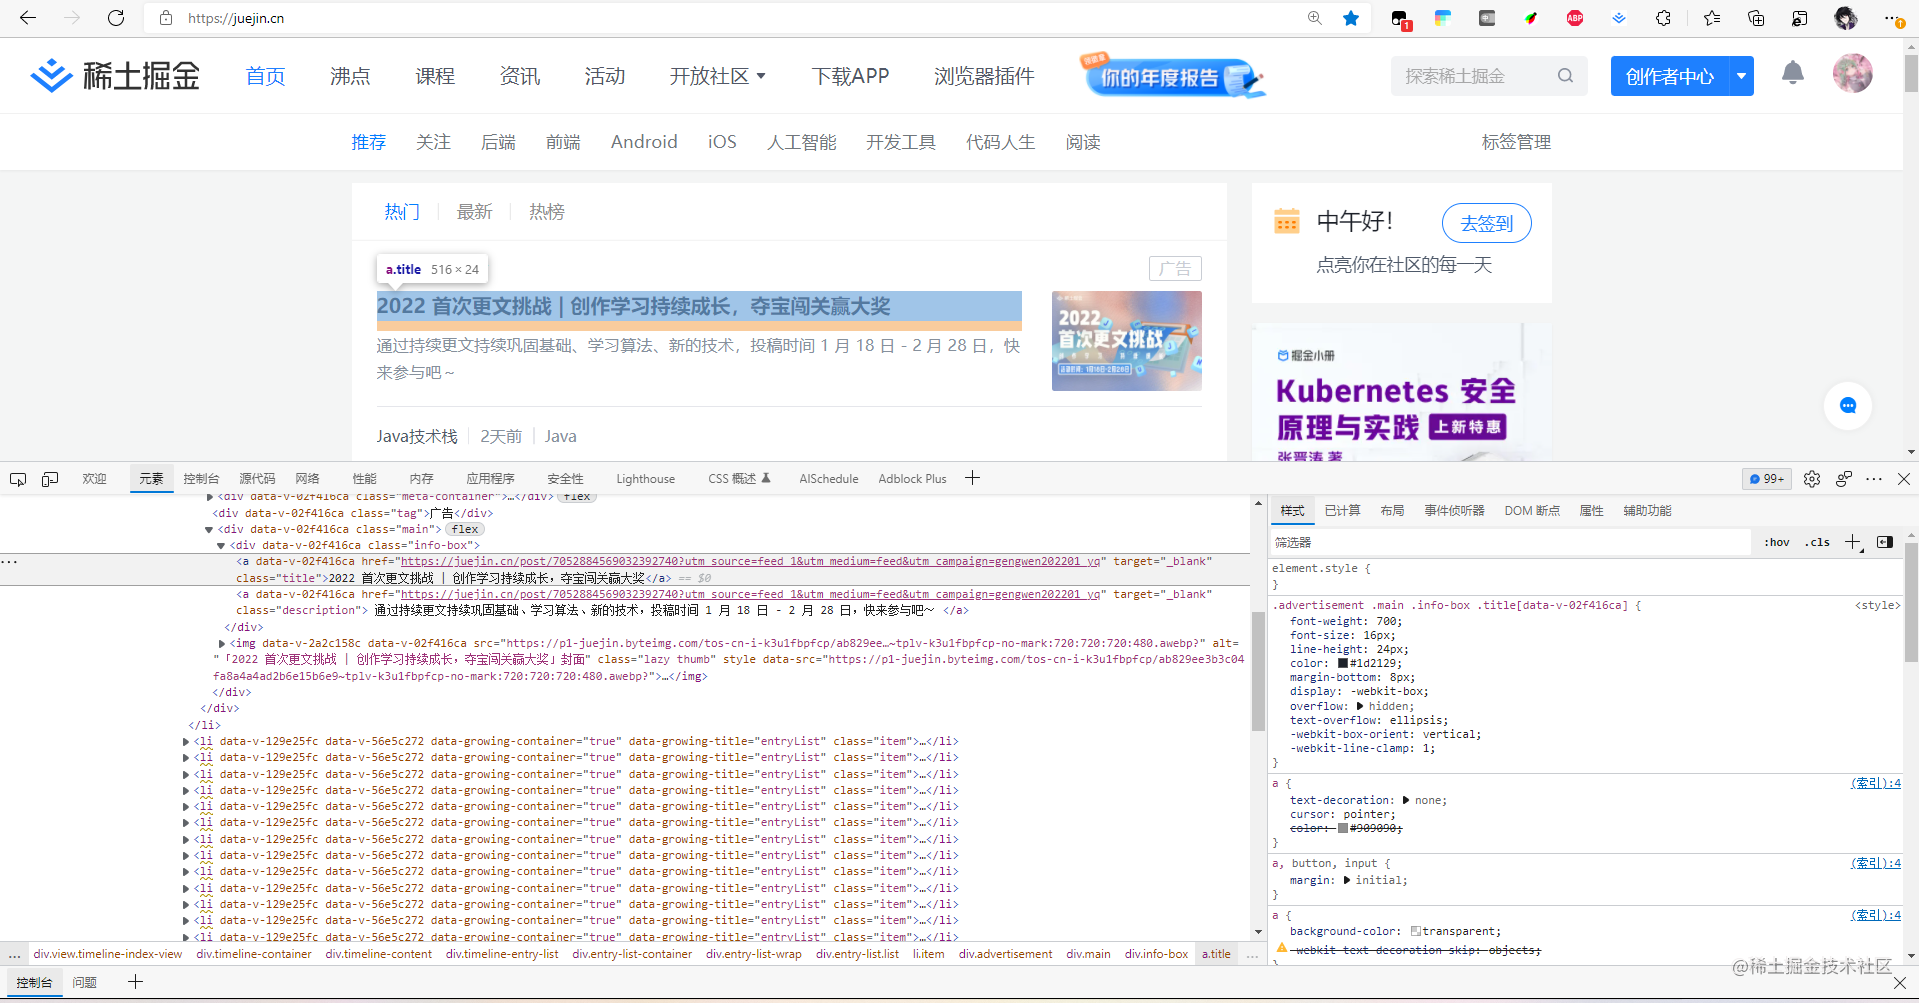
Chrome DevTools is the built-in debugging tool of Google Chrome. It is extremely powerful, and many modern browsers have also adopted this debugging tool. It can dynamically add/remove styles and display them in real-time.
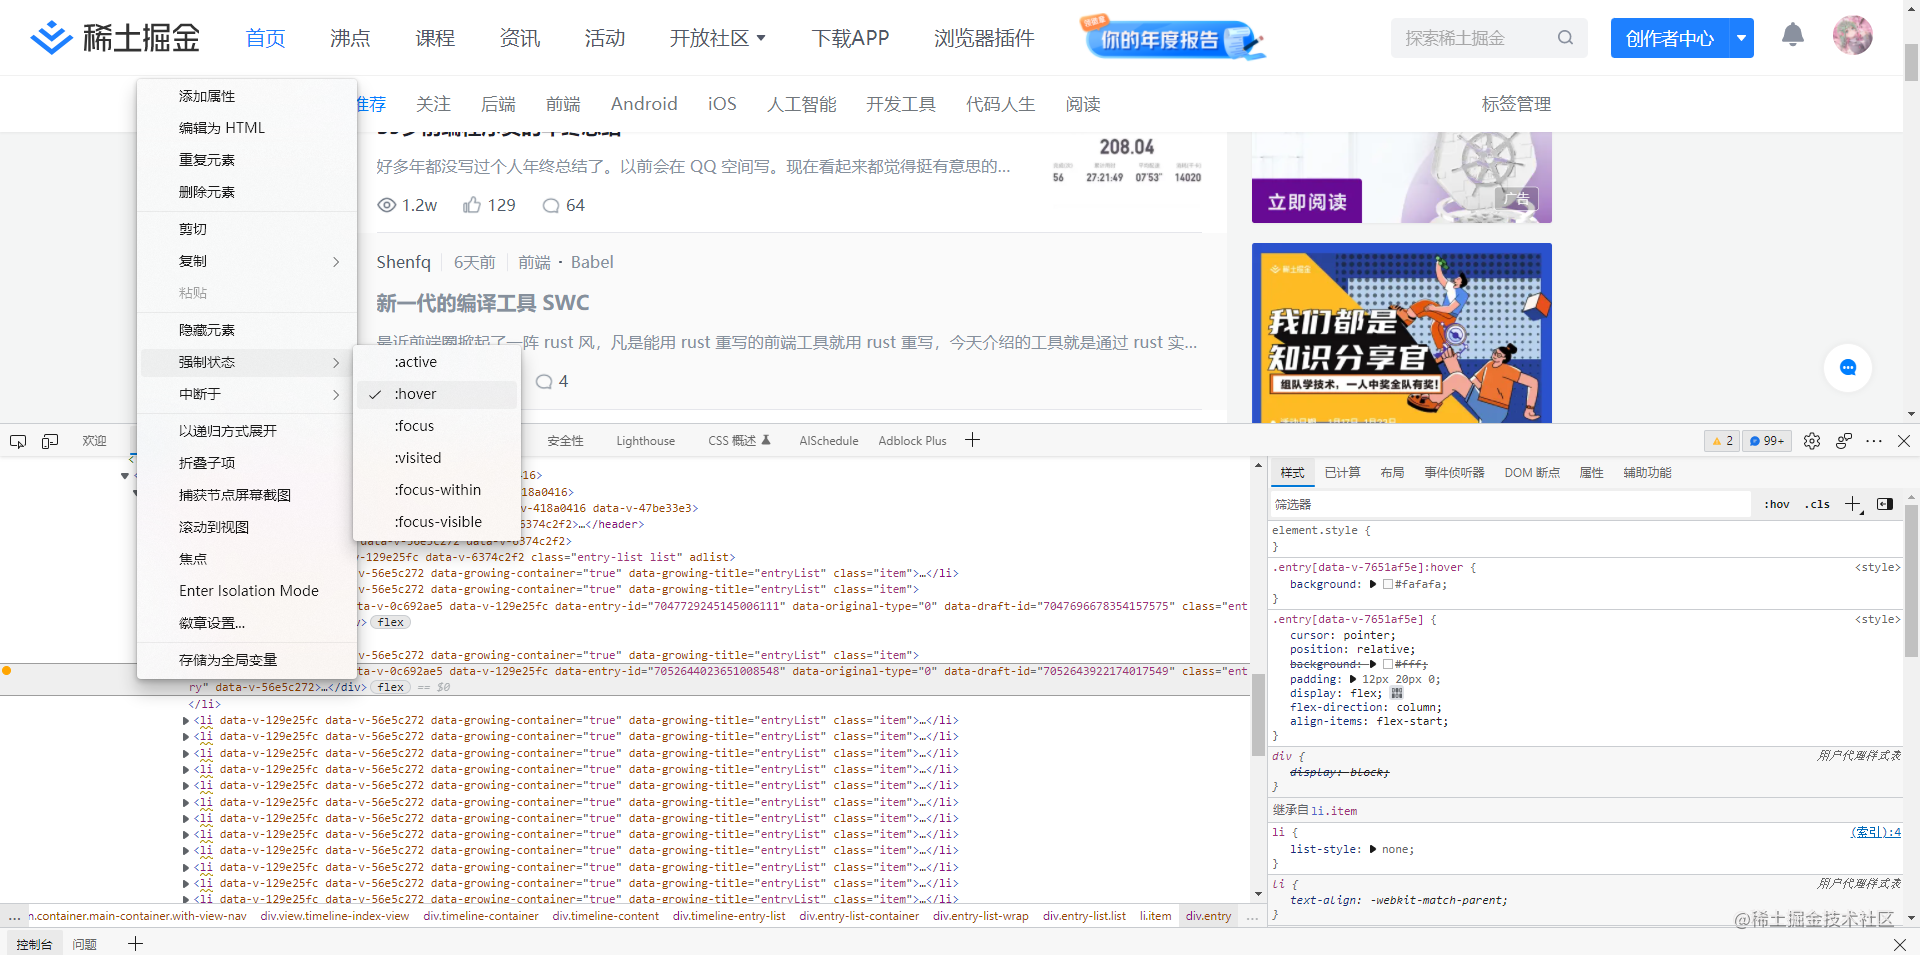
Forcing State Display
You can force the display of elements that only appear in certain states (such as hover, active, etc.)
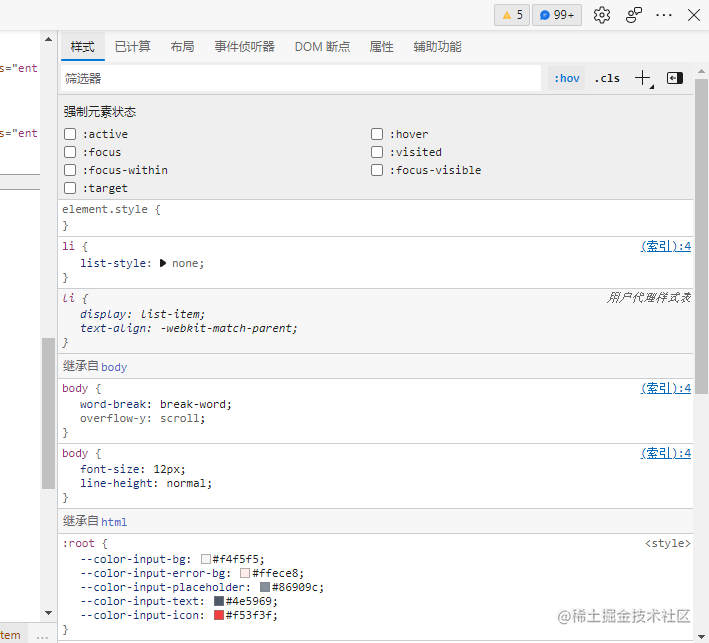
You can also force element states or add pseudo-classes through the style panel on the right side
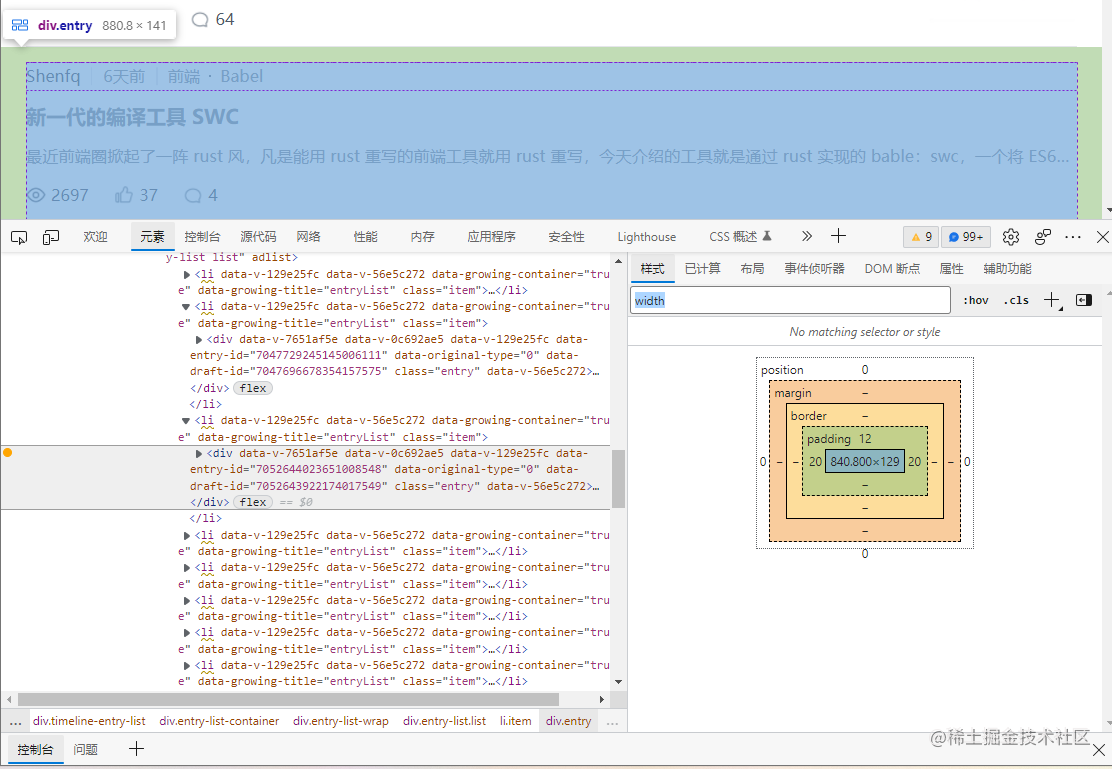
You can also filter styles
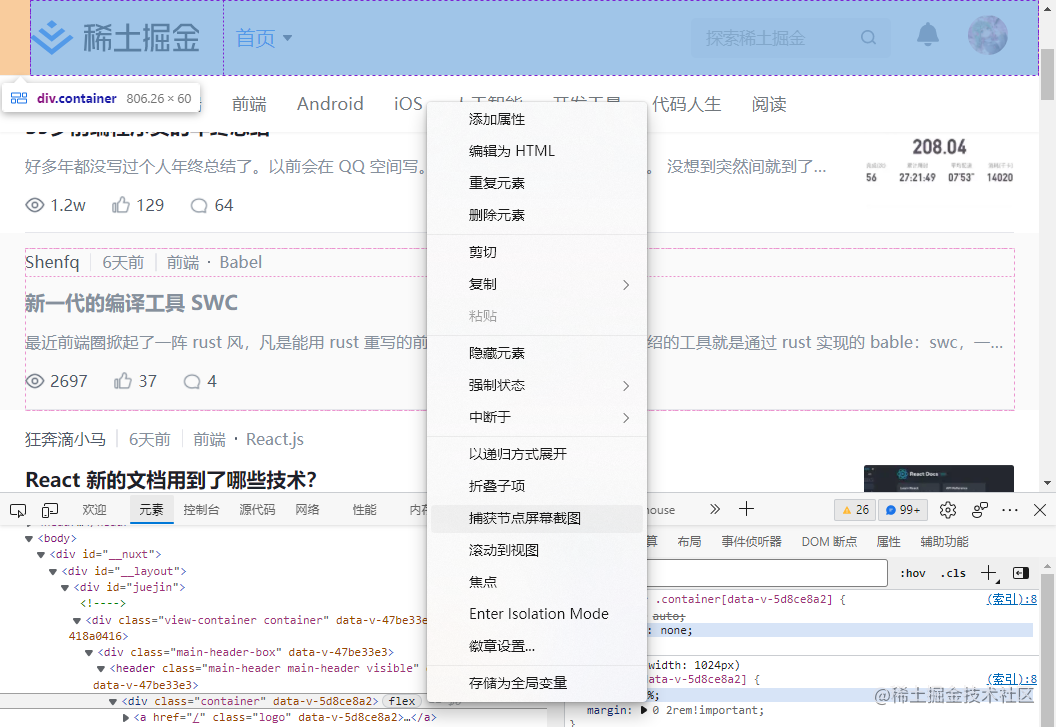
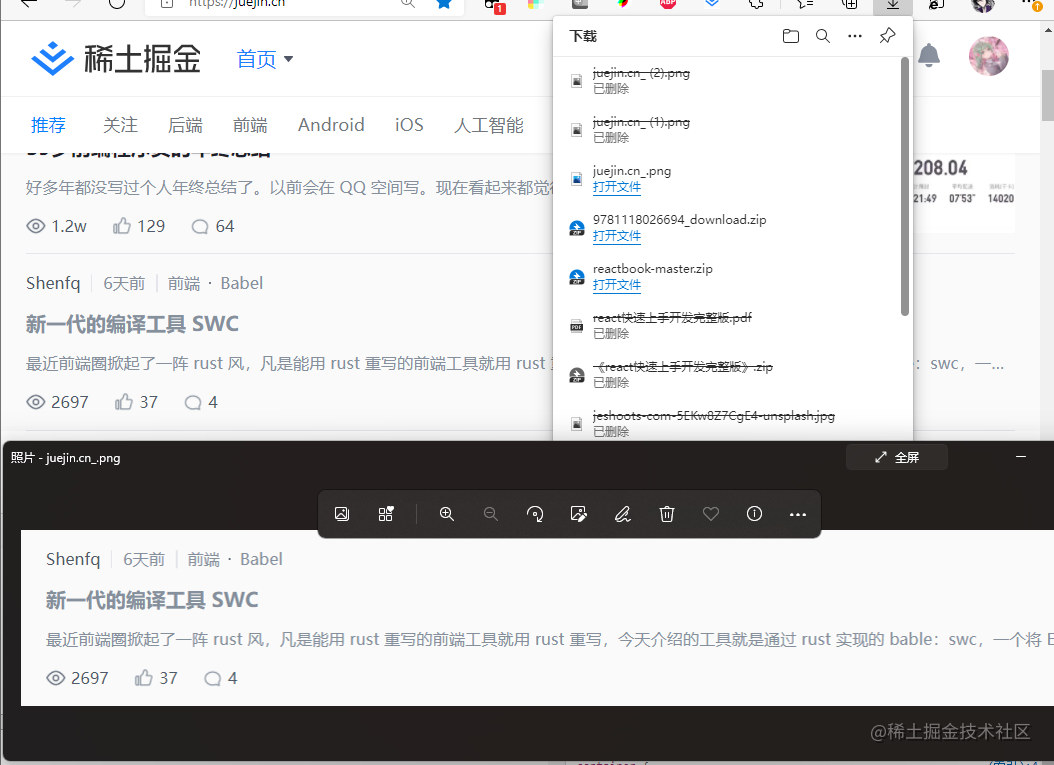
Screenshots
Yes, you can take screenshots of nodes, which is quite amazing!
Console
The console.log in JS is recorded here, which needs no introduction — everyone has used it.
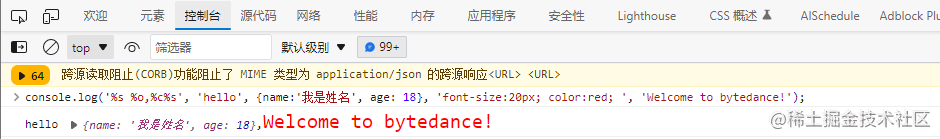
However, one thing worth mentioning is that you can also output styled text for quick identification during debugging, such as:
console.log('%s %o,%c%s', 'hello', { name: '我是姓名', age: 18 }, 'font-size:20px; color:red; ', 'Welcome to bytedance!');Here, %s outputs a string, %o outputs an object, and %c outputs styles (similar to C/C++ formatted output, but %c here is for styles).
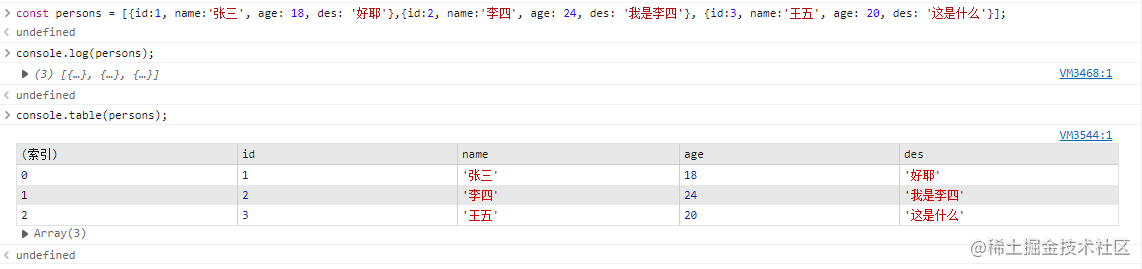
console.table can visualize an array of objects in a very convenient way.
const persons = [
  { id: 1, name: '张三', age: 18, des: '好耶' },
  { id: 2, name: '李四', age: 24, des: '我是李四' },
  { id: 3, name: '王五', age: 20, des: '这是什么' },
];
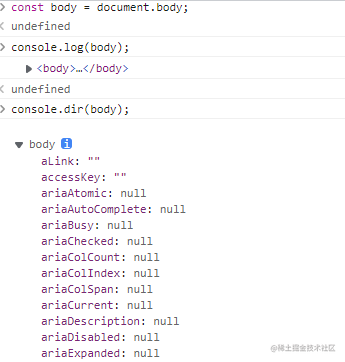
Tree structure display with dir
Source Tab
As the name suggests, it displays the content of source code, where you can add breakpoints, perform step-by-step debugging, and more.
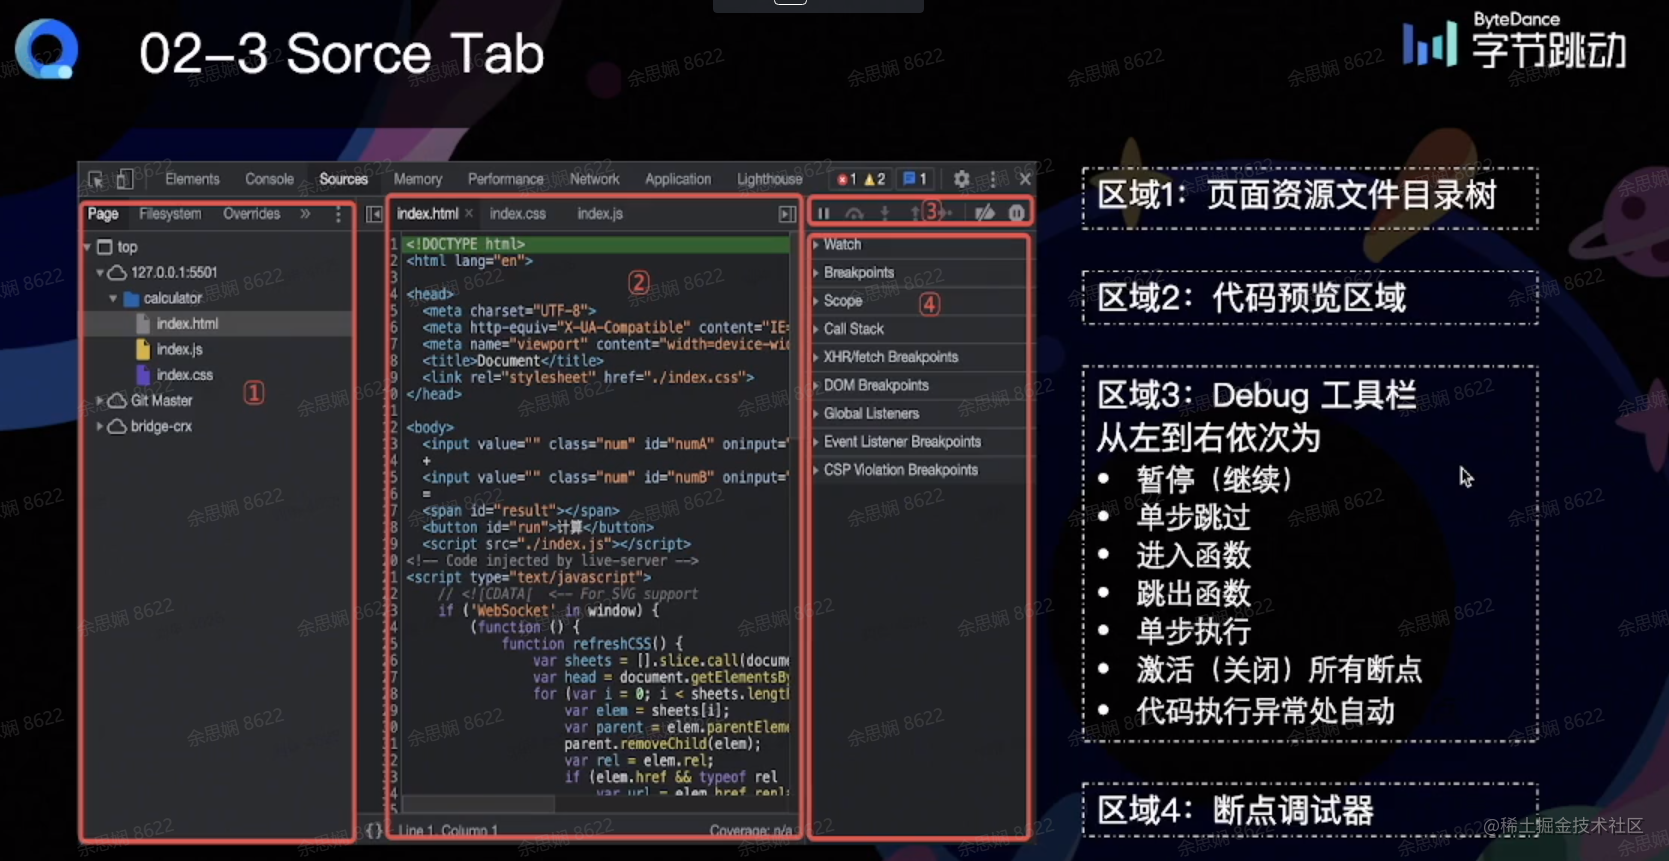
Executing debugger or setting a breakpoint at a certain line in the code will pause execution at that line, after which you can continue with step-by-step debugging. I won’t go into too much detail about the subsequent debugging — just try it hands-on and you’ll understand. (Those who have done backend debugging will find this very familiar, as it’s essentially setting a breakpoint.)
Other features include: XHR/fetch breakpoints that trigger when a request is made, adding breakpoints to element structures (for deletion, etc.), scope which lets you view the scope list (including closures), and CallStack which shows the current JavaScript call stack.
How to Debug Minified Code? SourceMap
Front-end code has an inherent “open source” nature. For security reasons, JavaScript code is typically minified by tools like webpack, resulting in code that is usually compressed into a single line with variables replaced by a, b, etc., making it completely unreadable. So how do we debug minified code?
When webpack bundles, it can additionally produce a Source Map program that maps the minified code back to the actual files. When an exception is thrown, it maps the error back to the original code. The Source Map is removed before going to production.
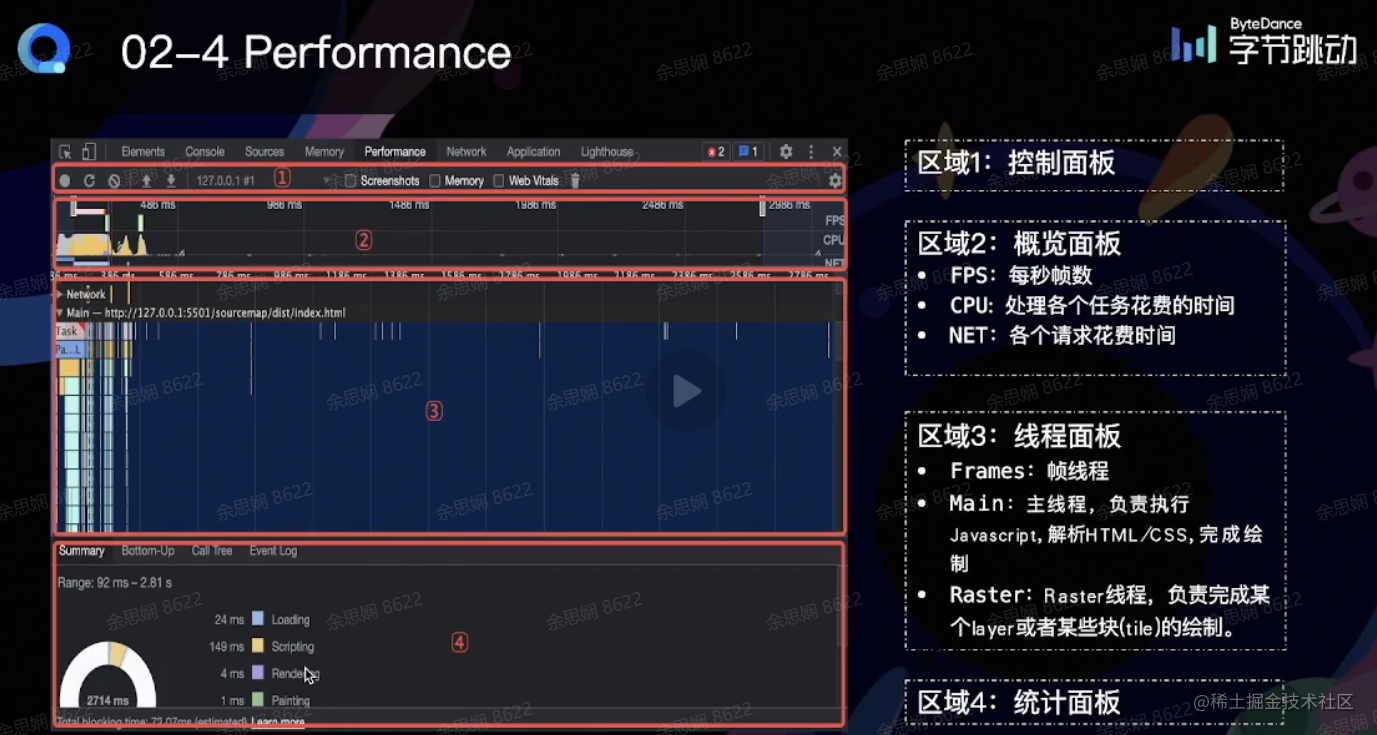
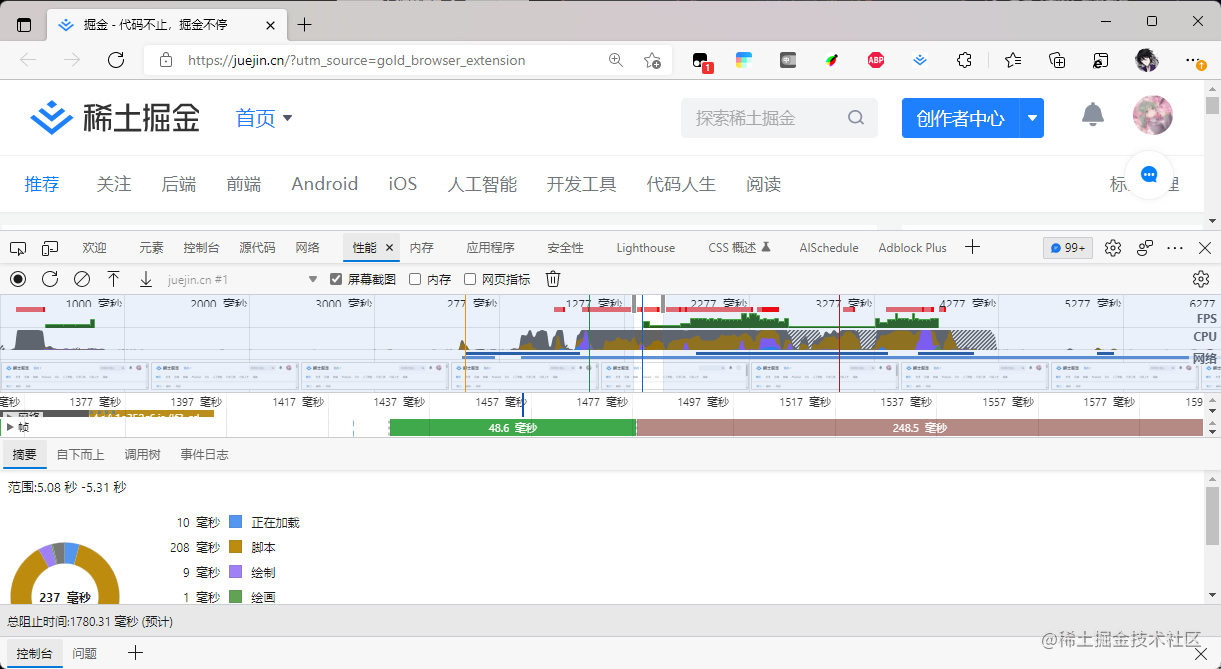
Performance
The Performance panel can generate reports, including:
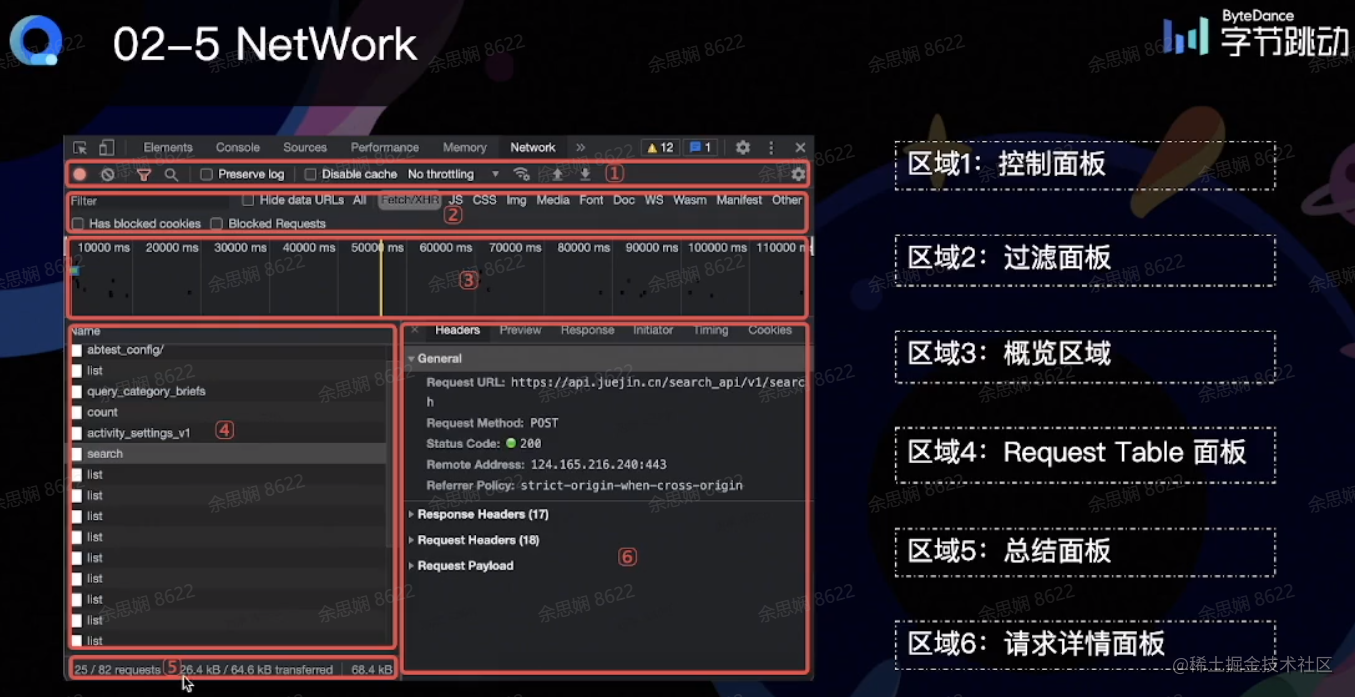
Network
The panel for viewing network requests, inspecting request headers/responses, etc.
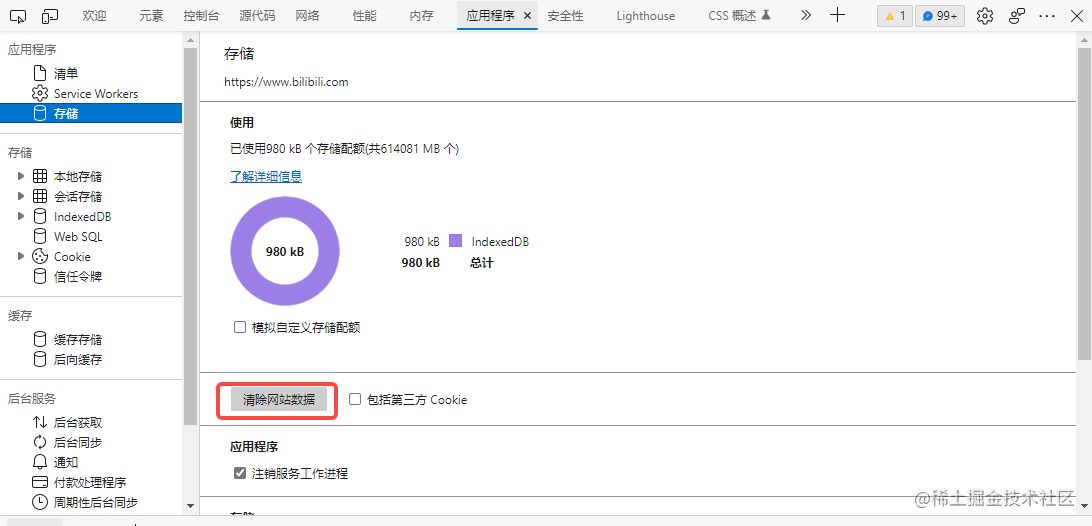
Application
This panel displays information related to local storage:
- Local Storage
- Session Storage
- IndexedDB
- Web SQL
- Cookie
Tip: Clicking “Clear Site Data” in the Storage section of this panel will clear the local storage data for the webpage, eliminating the need to open browser settings to clear it.
Mobile H5 Debugging
Real Device Debugging
iOS
- Connect iPhone to Mac using a Lightning cable
- Enable Web Inspector on iPhone (Settings -> Safari -> Advanced -> Enable Web Inspector)
- Open the page to debug in Safari on the iPhone
- Open Safari on Mac for debugging (Menu Bar -> Develop -> iPhone Device Name -> Select the debug page)
- Debug in the Safari Developer Tools popup
If you don’t have an iPhone, you can install Xcode from the Mac App Store and use its built-in iOS simulator
Android
- Connect the phone to the computer using a USB cable
- Enable Developer Mode on the phone. Check USB Debugging and allow debugging
- Open Chrome browser on the computer, enter
chrome://inspect/#devicesin the address bar and check the “Discover USB devices” option - Allow remote debugging on the phone and access the debug page
- Click the inspect button on the computer
- Enter the debugging interface
This method is generally not recommended; scanning a QR code directly on the phone provides a better experience
Proxy Debugging
Previously, you could use Fiddler to set up a proxy on your phone for packet capture. Now you can also use proxy tools to debug front-end pages on your phone. The principle is as follows:
- The computer acts as a proxy server
- The phone connects to the computer via HTTP proxy
- All requests from the phone pass through the proxy server
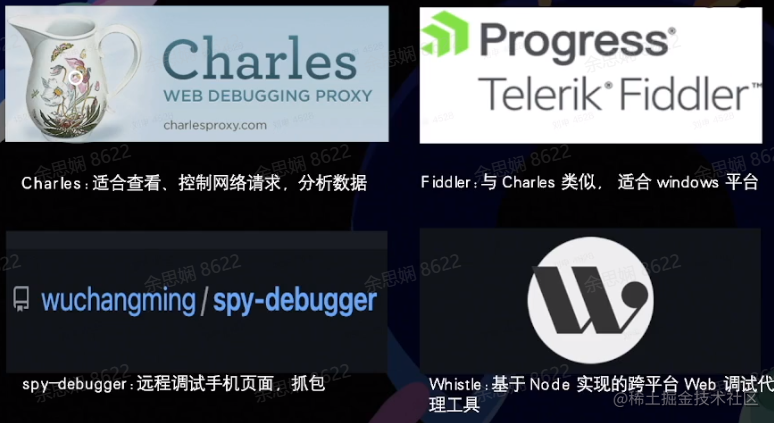
The instructor used Charles as an example in class. I’ll use my previous phone packet capture experience instead, which has been personally verified. For detailed steps, see this blog post. You need to install a certificate to capture HTTPS requests: Using Fiddler for Android Phone Packet Capture
After configuring the proxy, you can access development environment pages from your phone! Other commonly used tools are shown below:
Common Development and Debugging Tips
Live Editing with Override
- Open Overrides under the Sources panel
- Click “Select folders for Overrides” and select a local empty folder directory
- Grant permission
- Modify the code in the page and save after modifications
- Open DevTools, click the three dots in the upper right corner -> More tools -> Changes, and you can see all modifications
The recording is very intuitive. Changes won’t disappear after refreshing, and you can also see what was modified.
Using Proxies to Solve Cross-Origin Issues During Development
Browsers have a built-in Same-origin policy. Requests from different origins will cause cross-origin issues, meaning that if any of the protocol, IP, or port number differs, cross-origin issues will occur.
Enabling Local Source Maps
When Source Maps don’t exist in production, you can use the Map Local network mapping feature to access local Source Map files.
Rubber Duck Debugging Method
Legend has it that a programming master always carried a rubber duck. When debugging code, he would place the rubber duck on the desk and explain every line of code in detail to the duck, and soon the problem would be located and fixed.
— “The Pragmatic Programmer”
So this is where it comes from! This is a great method for organizing your problem logic.
Summary and Reflections
Debugging in front-end development is a very important part. This lesson provided a very detailed explanation of using Chrome DevTools on PC and debugging for mobile development, which was very insightful.
Most of the content cited in this article comes from the instructor’s lecture, MDN, and an external blog post: Using Fiddler for Android Phone Packet Capture
喜欢的话,留下你的评论吧~