
This article has been machine-translated from Chinese. The translation may contain inaccuracies or awkward phrasing. If in doubt, please refer to the original Chinese version.
Example charts in this article were created by AI
I’ve updated the blog with a new feature that renders Infographic charts, so let me introduce it here.
Infographic is a new-generation declarative infographic chart generation and rendering framework released by the AntV team at Ant Group. It is a declarative infographic rendering engine designed for the AI era.
It uses concise declarative syntax, supports AI streaming output and real-time rendering, and comes with over 200 built-in infographic templates, components, and layouts.
The framework provides high-quality SVG output, a rich theme system (including hand-drawn and gradient styles), and accompanying online editors and Skills, greatly improving the efficiency of information presentation.
After using it, I feel it’s better than Mermaid charts. I can also tweak the theme later.
What is Infographic
Infographic is a chart format that presents data, information, and knowledge visually. Compared to traditional text descriptions, infographics can convey information more intuitively and attractively.
In this blog, you can use the infographic tag directly in Markdown code blocks to create various types of infographics, supporting:
- List displays
- Process descriptions
- Data comparisons
- Hierarchical structures
- Statistical charts
- Quadrant analysis
- Relationship displays
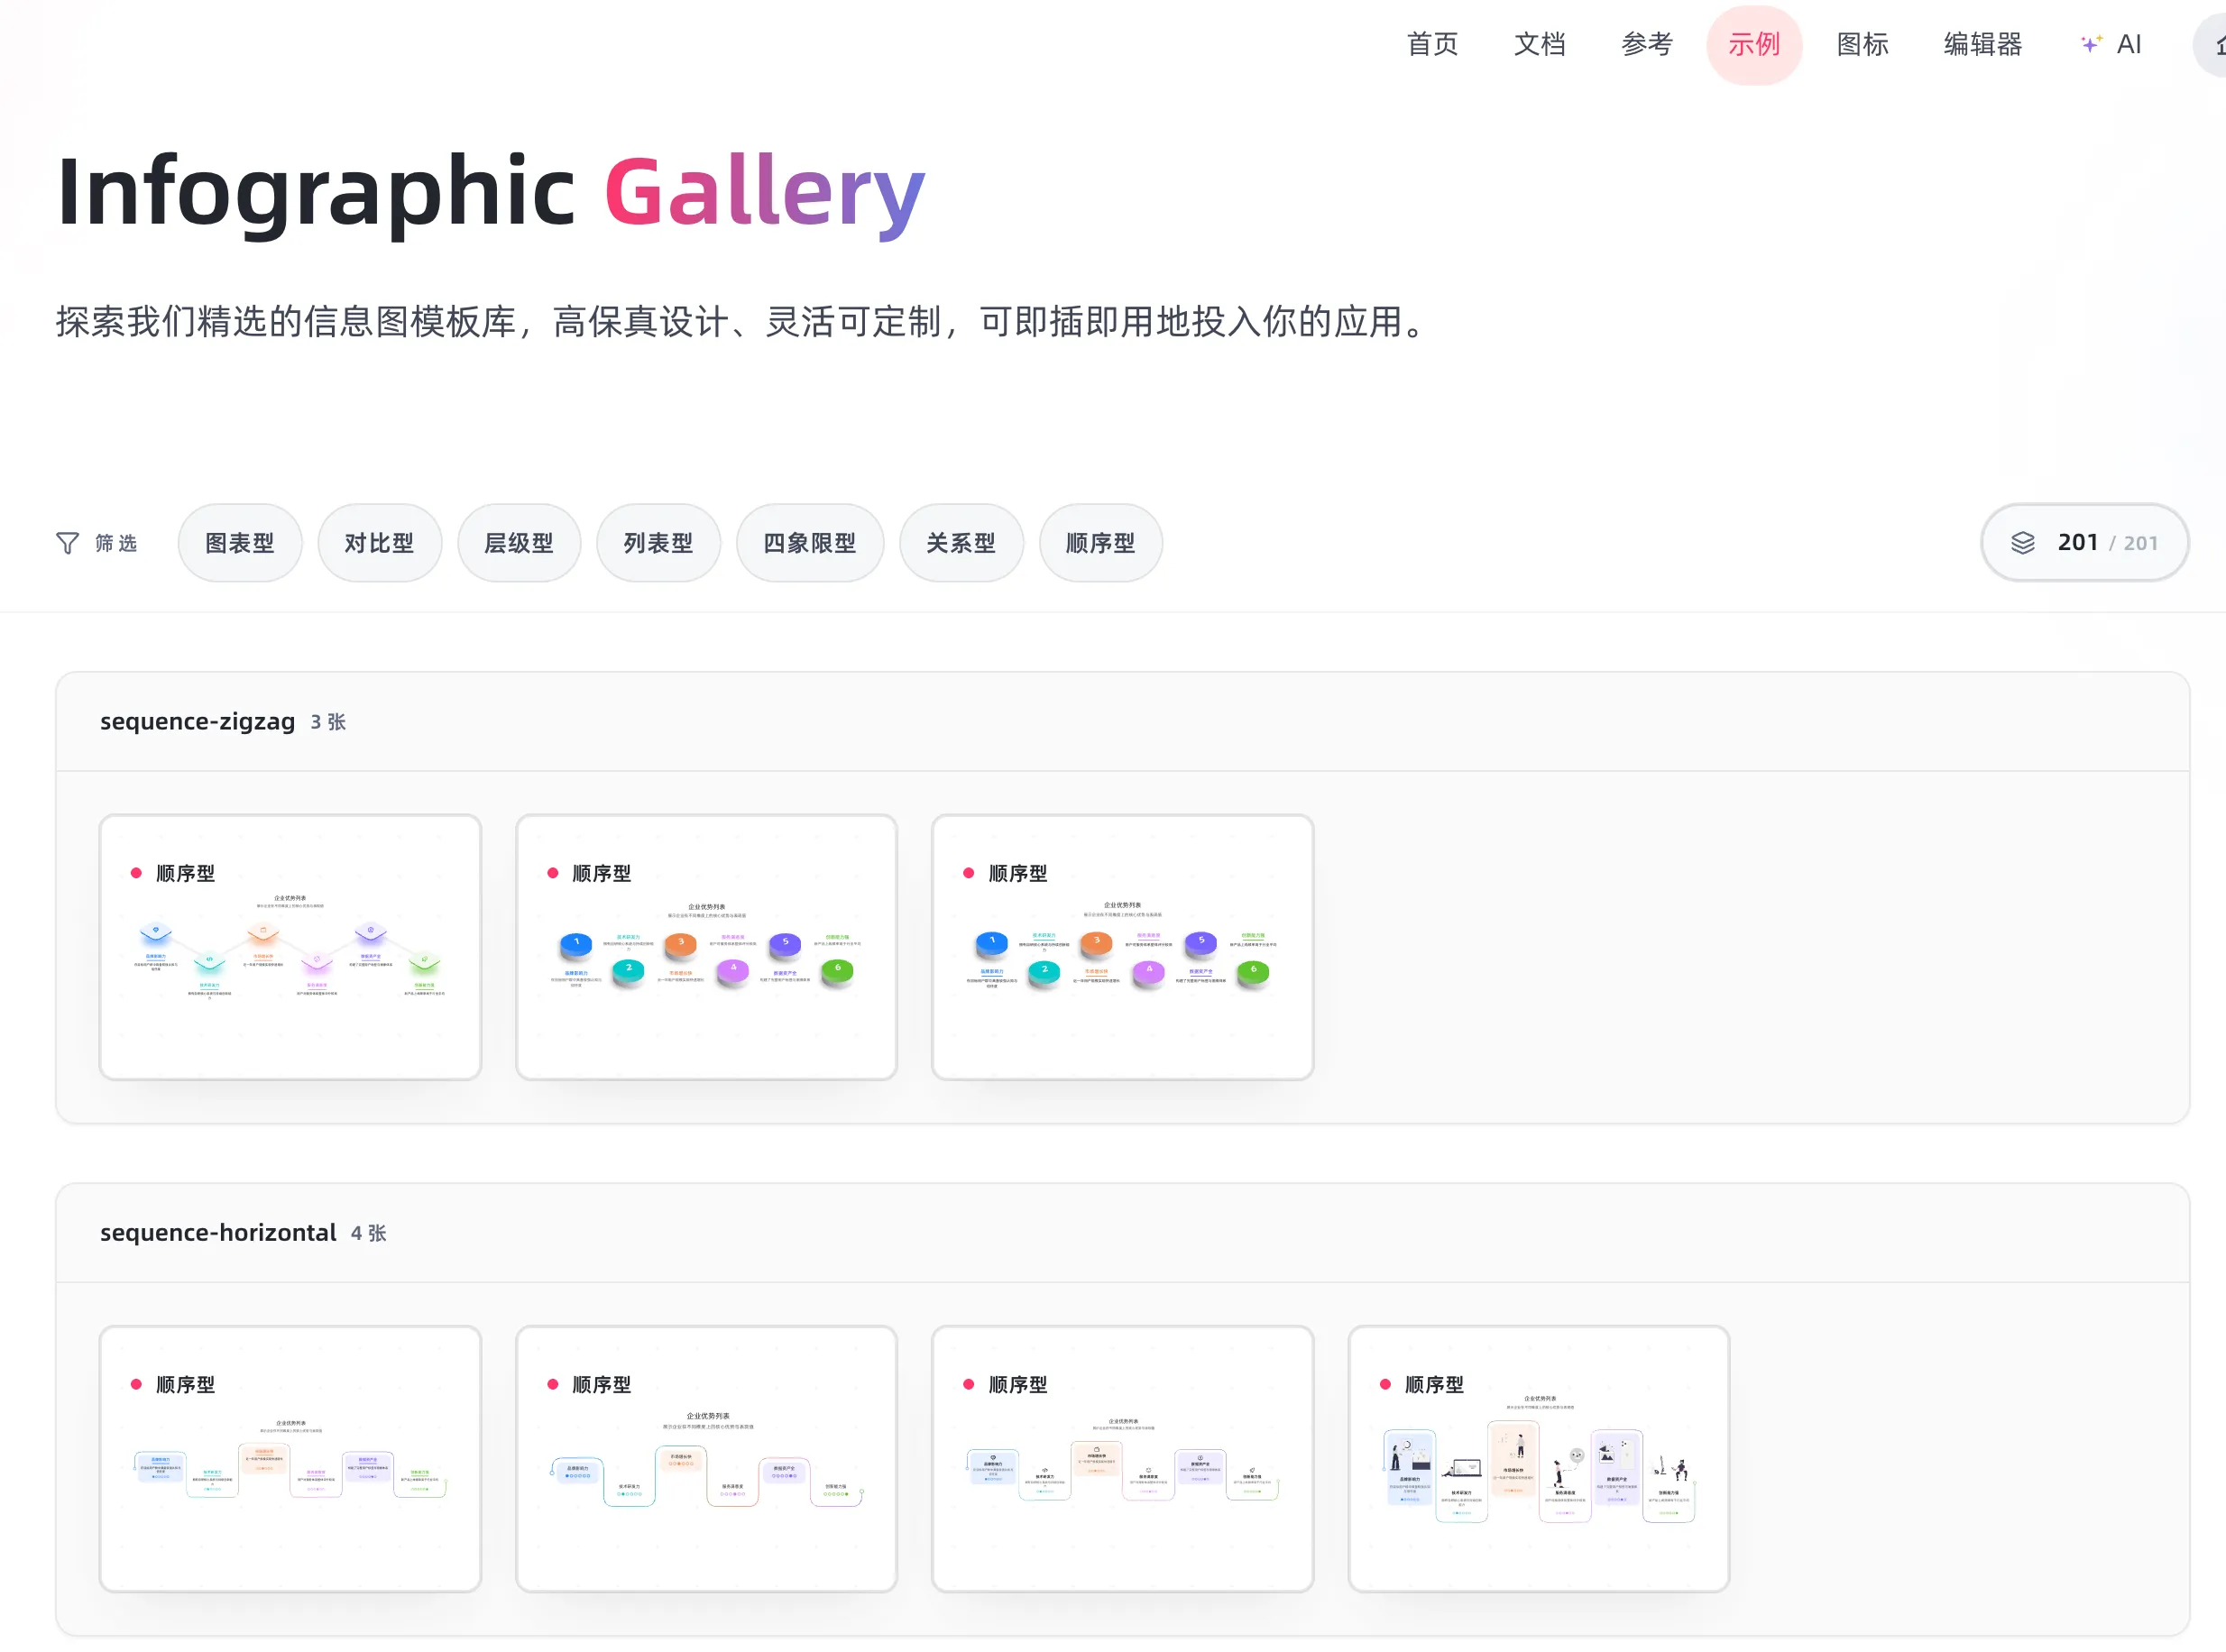
- And many other templates, see the Infographic official website gallery


How Is It Written?
The official repository now has skills, which I’ve also integrated into my blog. You just need to have Claude Code create them based on article information using these skills — very convenient.

If you want to write them yourself, the official team also provides an editor, and there are many community-contributed editors.
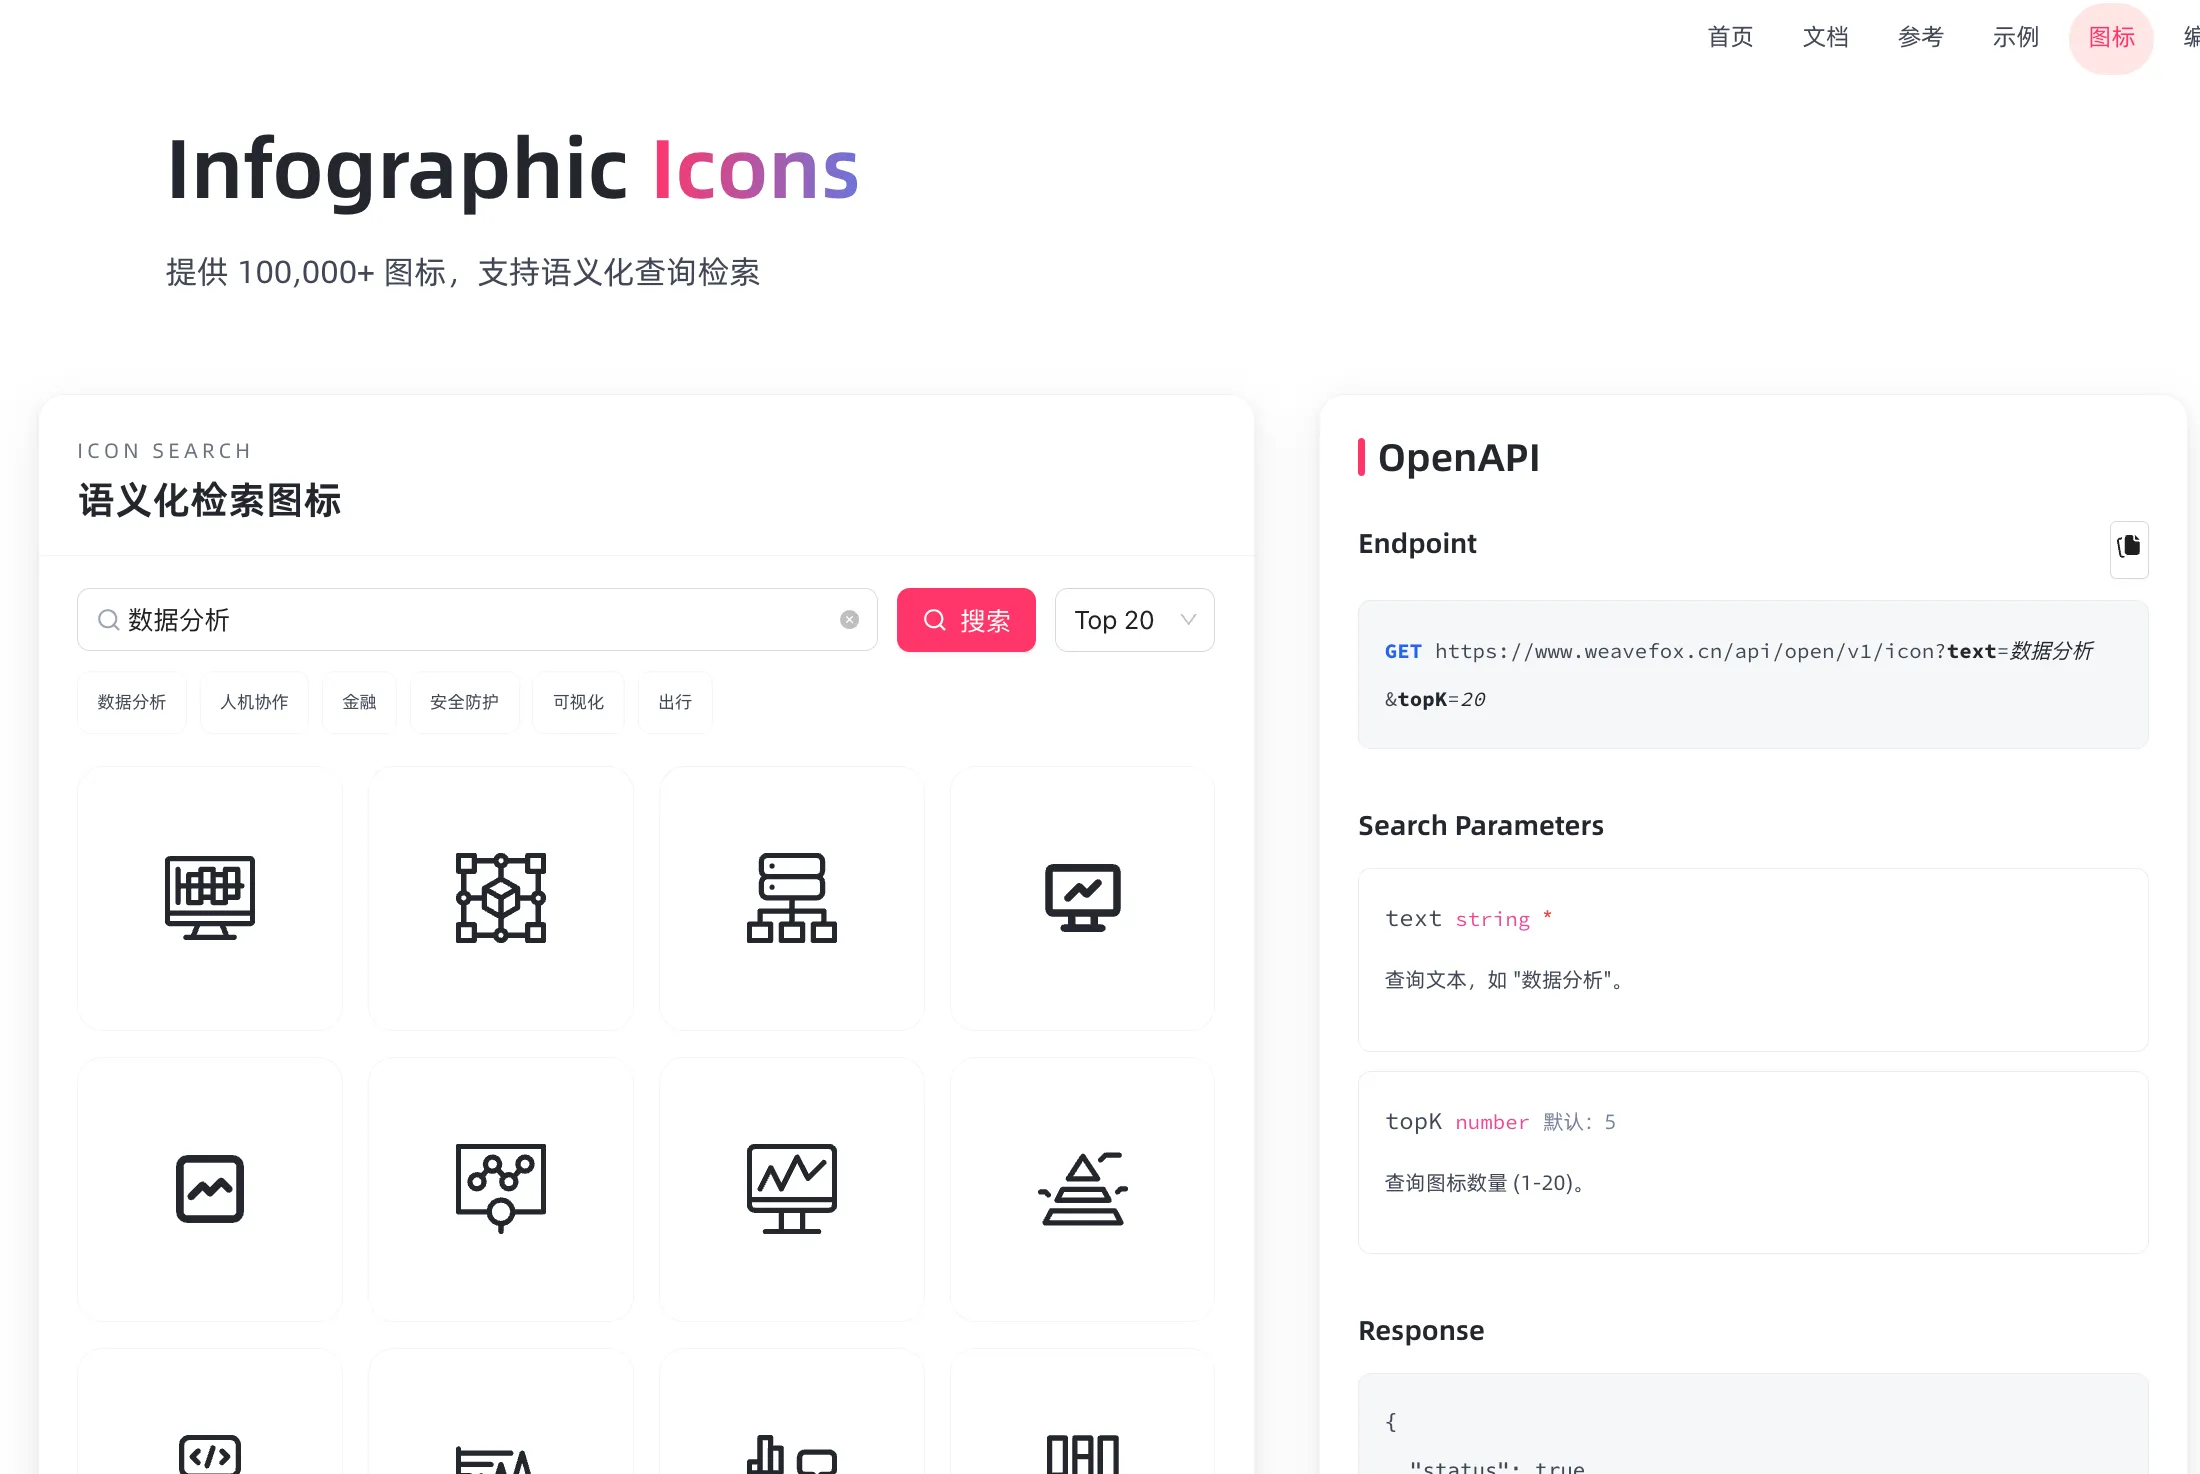
Infographic Gallery has many examples, and icons can be searched semantically at Infographic Icon.
Basic Syntax
Use the infographic tag in a code block. The first line specifies the template name, then define data using YAML-like syntax:
```infographic
infographic <template-name>
data
  title Title
  desc Description
  items
    - label Item Name
      desc Item Description
      icon icon-name
```
List Templates (list-*)
Suitable for displaying information lists, feature checklists, tech stacks, etc.
Grid Card Layout
Use the list-grid-badge-card template for card-style lists:
infographic list-grid-badge-card
data
  title 前端技术栈
  desc 现代化前端开发常用技术
  items
    - label TypeScript
      desc 类型安全的 JavaScript 超集
      icon language-typescript
    - label React
      desc 用于构建用户界面的 JavaScript 库
      icon react
    - label Astro
      desc 现代化静态站点生成器
      icon mdi/rocket-launch
    - label Tailwind CSS
      desc 实用优先的 CSS 框架
      icon tailwind
    - label Vite
      desc 下一代前端构建工具
      icon mdi/lightning-bolt
    - label Biome
      desc 一体化的 Web 工具链
      icon biome
Candy Style Cards
Use list-grid-candy-card-lite to create more fun card styles:
infographic list-grid-candy-card-lite
data
  title 博客特色功能
  desc 本博客的特色功能如下
  items
    - label 深色模式
      icon mdi/brightness6
      illus creative-experiment
      desc 优雅的主题切换
      icon mdi/theme-light-dark
    - label 全站搜索
      desc 基于 Pagefind 的无后端搜索
      icon mdi/magnify
    - label Markdown 增强
      desc 支持 GFM、Mermaid、Infographic
      icon mdi/markdown
Horizontal Arrow List
Use list-row-horizontal-icon-arrow for linear lists:
infographic list-row-simple-horizontal-arrow
data
  title 企业优势列表
  desc 展示企业在不同维度上的核心优势与表现值
  items
    - label 品牌影响力
      value 85
      desc 在目标用户群中具备较强认知与信任度
      time 2021
      icon mingcute/diamond-2-fill
      illus creative-experiment
    - label 技术研发力
      value 90
      desc 拥有自研核心系统与持续创新能力
      time 2022
      icon mingcute/code-fill
      illus code-thinking
    - label 市场增长快
      value 78
      desc 近一年用户规模实现快速增长
      time 2023
      icon mingcute/wallet-4-line
      illus business-analytics
    - label 服务满意度
      value 88
      desc 用户对服务体系整体评分较高
      time 2020
      icon mingcute/happy-line
      illus feeling-happy
    - label 数据资产全
      value 92
      desc 构建了完整用户标签与画像体系
      time 2022
      icon mingcute/user-4-line
      illus mobile-photos
    - label 创新能力强
      value 83
      desc 新产品上线频率高于行业平均
      time 2023
      icon mingcute/rocket-line
      illus creativity
theme light
  palette antv
Sequence/Process Templates (sequence-*)
Suitable for displaying steps, processes, timelines, and other ordered information.
Zigzag Steps
Use sequence-zigzag-steps-underline-text for process steps:
infographic sequence-zigzag-steps-underline-text
data
  title 博客搭建流程
  items
    - label 选择框架
      desc 选择 Astro 作为静态站点生成器
    - label 设计主题
      desc 参考 Shoka 主题进行设计
    - label 开发功能
      desc 实现文章系统、搜索、评论等功能
    - label 部署上线
      desc 使用 Vercel 进行自动化部署
Circular Process
Use sequence-circular-simple for circular processes:
infographic sequence-circular-simple
data
  title PDCA 循环
  items
    - label Plan
      desc 制定计划
    - label Do
      desc 执行实施
    - label Check
      desc 检查验证
    - label Act
      desc 改进优化
Vertical Roadmap
Use sequence-roadmap-vertical-simple for timelines or roadmaps:
infographic sequence-roadmap-vertical-simple
data
  title 项目里程碑
  items
    - label 2024 Q1
      desc 项目启动,完成基础架构
    - label 2024 Q2
      desc 实现核心功能,开始内容迁移
    - label 2024 Q3
      desc 优化性能,添加高级功能
    - label 2024 Q4
      desc 正式发布,持续优化
Pyramid Structure
Use sequence-pyramid-simple for hierarchical progressive relationships:
infographic sequence-pyramid-simple
data
  title 马斯洛需求层次
  items
    - label 自我实现
    - label 尊重需求
    - label 社交需求
    - label 安全需求
    - label 生理需求
theme
  palette
    - #8b5cf6
    - #3b82f6
    - #06b6d4
    - #10b981
    - #f59e0b
Comparison Templates (compare-*)
Suitable for binary comparisons, pros and cons analysis, etc.
Horizontal Binary Comparison
Use compare-binary-horizontal-simple-fold for comparisons:
infographic compare-binary-horizontal-simple-fold
data
  title SSR vs SSG
  items
    - label 服务端渲染 (SSR)
      children
        - label 实时生成
          desc 每次请求时渲染页面
        - label 动态内容
          desc 适合频繁更新的内容
        - label 服务器负载
          desc 需要服务器资源
    - label 静态生成 (SSG)
      children
        - label 构建时生成
          desc 提前生成所有页面
        - label 静态内容
          desc 适合内容相对稳定的场景
        - label CDN 友好
          desc 可以部署到 CDN 边缘节点
SWOT Analysis
Use compare-swot for SWOT analysis:
infographic compare-swot
data
  title 技术博客 SWOT 分析
  items
    - label 优势 (Strengths)
      children
        - label 技术积累
        - label 个人品牌
        - label 知识沉淀
    - label 劣势 (Weaknesses)
      children
        - label 时间投入
        - label 持续更新压力
        - label 初期流量低
    - label 机会 (Opportunities)
      children
        - label 技术社区活跃
        - label 开源生态发展
        - label 个人成长空间
    - label 威胁 (Threats)
      children
        - label 内容同质化
        - label 平台竞争
        - label 技术快速迭代
Hierarchy Templates (hierarchy-*)
Suitable for displaying organizational structures, classification systems, and other tree-like relationships.
System Layer Structure
Use hierarchy-structure for multi-layer architecture, ideal for system architecture and module layering:
infographic hierarchy-structure
data
  title 系统分层结构
  desc 展示不同层级的模块与功能分组
  items
    - label 展现层
      children
        - label 小程序
        - label APP
        - label PAD
        - label 客户端
        - label WEB
    - label 应用层
      children
        - label 核心模块
          children
            - label 功能1
            - label 功能2
            - label 功能3
            - label 功能4
            - label 功能5
            - label 功能6
        - label 基础模块
          children
            - label 功能1
            - label 功能2
            - label 功能3
            - label 功能4
            - label 功能5
            - label 功能6
        - label 其他模块
          children
            - label 功能1
            - label 功能2
            - label 功能3
            - label 功能4
            - label 功能5
            - label 功能6
    - label 平台层
      children
        - label 模块1
          children
            - label 功能1
            - label 功能2
            - label 功能3
            - label 功能4
        - label 模块2
          children
            - label 功能1
            - label 功能2
            - label 功能3
            - label 功能4
        - label 模块3
          children
            - label 功能1
            - label 功能2
            - label 功能3
            - label 功能4
Tech Style Tree Chart
Use hierarchy-tree-tech-style-capsule-item for hierarchical structures:
infographic hierarchy-tree-tech-style-capsule-item
data
  title 前端技术体系
  items
    - label 前端开发
      children
        - label 基础技术
          children
            - label HTML
            - label CSS
            - label JavaScript
        - label 框架/库
          children
            - label React
            - label Vue
            - label Astro
        - label 工程化
          children
            - label Vite
            - label Webpack
            - label Rollup
Rounded Rectangle Tree Chart
Use hierarchy-tree-curved-line-rounded-rect-node for hierarchy display:
infographic hierarchy-tree-curved-line-rounded-rect-node
data
  title 博客内容分类
  items
    - label 技术文章
      children
        - label 前端
          children
            - label React
            - label TypeScript
        - label 后端
          children
            - label Node.js
            - label 数据库
    - label 生活随笔
      children
        - label 年度总结
        - label 读书笔记
Chart Templates (chart-*)
Suitable for displaying statistical data, numerical comparisons, etc.
Column Chart
Use chart-column-simple for data comparisons:
infographic chart-column-simple
data
  title 月度文章发布统计
  items
    - label 1月
      value 5
    - label 2月
      value 8
    - label 3月
      value 12
    - label 4月
      value 6
    - label 5月
      value 10
    - label 6月
      value 15
Bar Chart
Use chart-bar-plain-text for horizontal comparisons:
infographic chart-bar-plain-text
data
  title 编程语言使用占比
  items
    - label TypeScript
      value 45
    - label JavaScript
      value 25
    - label Python
      value 15
    - label Go
      value 10
    - label Others
      value 5
Pie Chart
Use chart-pie-plain-text for distribution:
infographic chart-pie-plain-text
data
  title 访问来源分布
  items
    - label 搜索引擎
      value 45
    - label 社交媒体
      value 30
    - label 直接访问
      value 15
    - label 外部链接
      value 10
Donut Chart
Use chart-pie-donut-pill-badge for donut charts:
infographic chart-pie-donut-pill-badge
data
  title 技术栈占比
  items
    - label 前端
      value 50
    - label 后端
      value 30
    - label DevOps
      value 20
Line Chart
Use chart-line-plain-text for trends:
infographic chart-line-plain-text
data
  title 博客访问量趋势
  items
    - label 第1周
      value 100
    - label 第2周
      value 150
    - label 第3周
      value 200
    - label 第4周
      value 280
    - label 第5周
      value 350
    - label 第6周
      value 420
Quadrant Analysis (quadrant-*)
Suitable for four-quadrant analysis, priority matrices, etc.
Simple Card Quadrant
Use quadrant-quarter-simple-card for quadrant analysis:
infographic quadrant-quarter-simple-card
data
  title 四象限分析
  items
    - label 重要且紧急
      desc 直接规避风险
      illus notify
    - label 重要不紧急
      desc 采取风险控制措施
      illus coffee
    - label 不重要但紧急
      desc 通过保险转移风险
      illus diary
    - label 不重要不紧急
      desc 选择接受风险
      illus invest
Relation Charts (relation-*)
Suitable for displaying relationships between elements.
Circular Icon Relations
Use relation-circular-progress for relationship networks:
infographic relation-circle-circular-progress
data
  title 子公司盈利分析
  desc 各子公司财务表现,盈利同比增长
  items
    - label 云计算子公司
      value 25
      desc 年度净利润率达25%,成为集团核心增长引擎
      icon mingcute/cardano-ada-fill
    - label 人工智能子公司
      value 40
      desc AI业务快速扩张,盈利同比增长40%
      icon mingcute/openai-fill
    - label 物联网子公司
      value 1000
      desc IoT设备出货量突破千万,盈利稳步提升
      icon mingcute/medium-fill
    - label 金融科技子公司
      value 18
      desc 数字支付业务增长迅猛,净利润率18%
      icon mingcute/paypal-fill
    - label 新能源子公司
      value 50
      desc 绿色能源项目实现规模化盈利,增长潜力巨大
      icon mingcute/drone-fill
Theme Customization
You can customize color schemes through a theme block:
infographic list-grid-badge-card
data
  title 自定义配色示例
  items
    - label 主色调
      desc 品牌主色
    - label 辅助色
      desc 强调色彩
    - label 中性色
      desc 背景文字
theme
  palette
    - #3b82f6
    - #8b5cf6
    - #f97316
    - #06b6d4
    - #10b981
Practical Tips
1. Choose the Right Template
Select the corresponding template based on the type of information you want to display:
- List information ->
list-* - Process steps ->
sequence-* - Data comparison ->
compare-*orchart-* - Hierarchical relationships ->
hierarchy-* - Priority analysis ->
quadrant-* - Associative relationships ->
relation-*
2. Use Icons Wisely
Use Material Design Icons to make infographics more vivid:
icon mdi/rocket-launch
icon mdi/heart
icon mdi/lightbulb
icon mdi/chart-line
3. Control Information Density
- Don’t include too many items per infographic (3-8 recommended)
- Use concise labels and descriptions
- Complex information can be split across multiple infographics
4. Theme Adaptation
Infographics automatically follow the blog’s dark/light theme toggle — no extra configuration needed.
Summary
Infographic provides powerful visualization capabilities for Markdown documents, making technical blogs, documentation, and notes more vivid and readable. Using various templates wisely can significantly enhance content expressiveness and readability.
For more templates and detailed documentation, visit the Infographic official website gallery.
喜欢的话,留下你的评论吧~